Have you ever gotten stuck on a gnarly algebraic problem, wishing there was a way to solve it without endless pen and paper scribbling? Well, fret no more! Maxima is a free, open-source computer algebra system (CAS) that can be your hero in the world of symbolic math.
What is Maxima?
Maxima is a powerful software that tackles complex mathematical problems with ease. Unlike calculators that provide numerical answers, Maxima works with symbolic expressions, allowing you to manipulate variables and functions like a pro. It can differentiate, integrate, solve equations, simplify expressions, and much more – all while showing you the steps involved.
Installing Maxima
Getting started with Maxima is a breeze. The software is available for various operating systems, including Windows, macOS, and Linux. Head over to the Maxima website (https://maxima.sourceforge.io/download.html) and download the installer for your specific system. The installation process is straightforward, just follow the on-screen instructions.
Beyond the Command Line: wxMaxima
While Maxima is a command-line program at its core, there are user-friendly graphical interfaces (GUIs) available to make your experience more interactive. One popular option is wxMaxima. This GUI provides a familiar window interface with menus and buttons, making it easier to input expressions, see results, and navigate through functionalities.
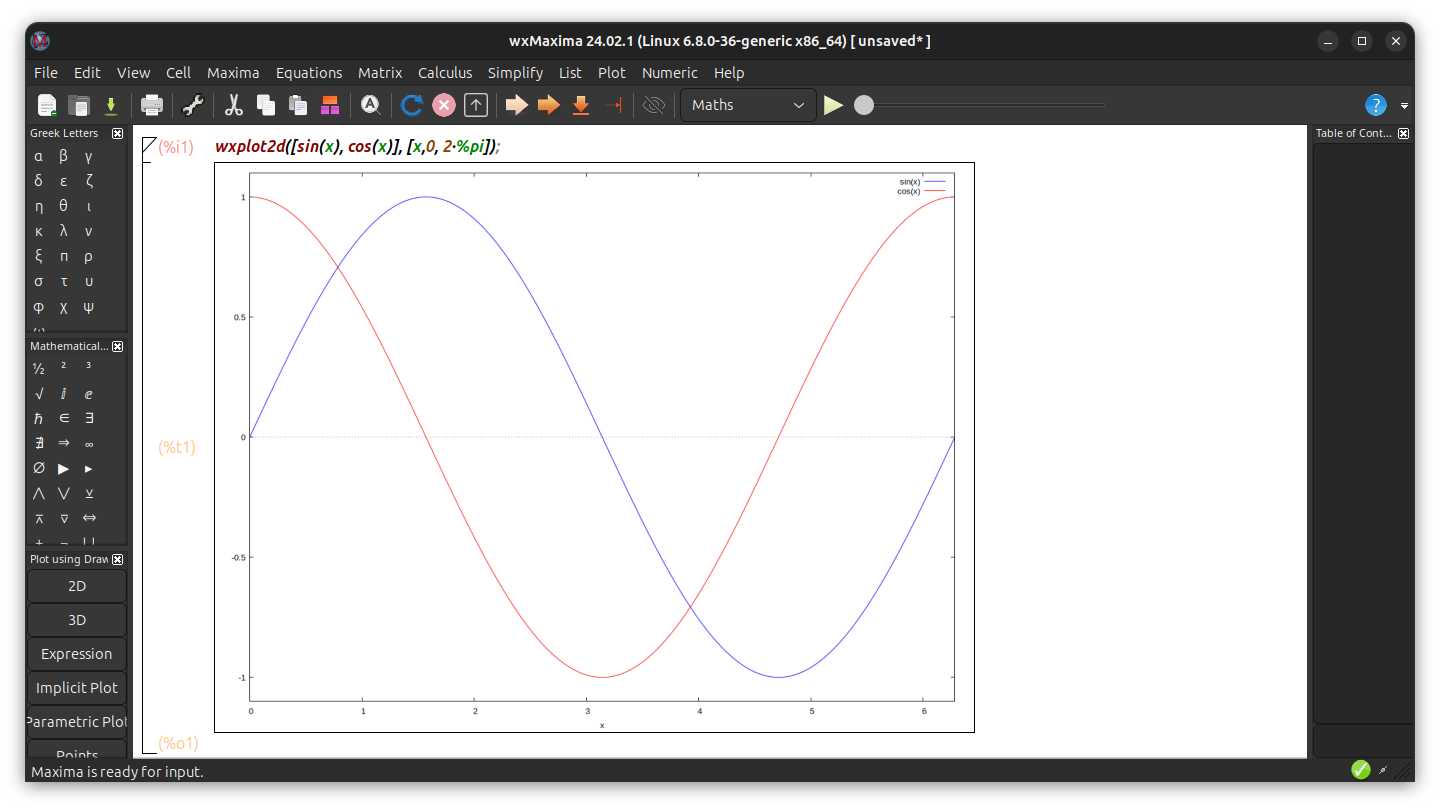
Let's Get Calculating: Simple Examples with Maxima
Here's a taste of what Maxima can do:
- Simplifying Expressions:
Let's say you want to simplify the expression 2x^2 + 3x - 5. In Maxima, simply type:
simplify(2*x^2 + 3*x - 5);
Maxima will return:
2 x^2 + 3 x - 5
(Maxima cleverly recognizes that the expression is already in its most simplified form!)
- Solving Equations: Need to find the solution to the equation x^2 + 2x - 3 = 0? Maxima can handle that:
solve(x^2 + 2*x - 3 = 0);
Maxima will present the solutions:
[x = - 3, x = 1]
- Taking Derivatives:
Finding the derivative of a function is no sweat for Maxima. Let's differentiate the function f(x) = x^3 + 2x^2:
diff(x^3 + 2*x^2);
Maxima will return the derivative:
3 x^2 + 4 x
These are just a few basic examples. Maxima has a vast library of functions for various mathematical needs. The program also boasts extensive documentation and a helpful online community to guide you on your symbolic math adventures.
More Exotic Examples
Here are some examples that showcase Maxima's capabilities for more intricate problems:
1. Systems of Nonlinear Equations:
Imagine you need to solve a system of two nonlinear equations:
eq1: x^2 + y^2 = 5
eq2: 2*x - y = 1
Maxima can tackle this using the solve function with a list of equations:
solve([eq1, eq2], [x, y]);
This might return solutions like:
        2 sqrt(6) - 2        4 sqrt(6) + 1
[[x = - -------------, y = - -------------],
              5                    5
                                            2 sqrt(6) + 2      4 sqrt(6) - 1
                                        [x = -------------, y = ------------]]-]]
                                                   5                  5
2. Matrix Operations and Eigenvalues:
Maxima can handle complex matrix manipulations. Let's define a matrix A and find its eigenvalues:
A := [[1, 2], [3, 4]];
eigenvals(A);
This will give the eigenvalues of matrix A.
3. Symbolic Integration:
Maxima can integrate complex functions. Let's find the indefinite integral of sin(x)*cos(x):
integrate(sin(x)*cos(x), x);
Maxima might return something like:
      2
   cos (x)
- -------
     2
4. Series Expansions:
Maxima can manipulate series expansions. Let's find the first four terms of the Taylor Series expansion of e^x centered at x = 0:
taylor(exp(x), x, 0, 4);
This will provide the first four terms of the series.
5. Differential Equations:
Maxima can solve certain types of differential equations. For example, let's solve the differential equation dy/dx = y^2 with the initial condition y(0) = 1:
dsolve(diff(y, x) = y^2, y(0) = 1);
Maxima might provide an implicit solution involving y and x.
These are just a few examples, and Maxima's capabilities extend far beyond these. With a little exploration, you can unlock its power for solving a wide range of challenging mathematical problems. Remember, the online documentation and community are valuable resources to delve deeper!
So, why not give Maxima a try? It's a free and powerful tool that can take your mathematical problem-solving skills to the next level.
Plotting with Maxima: Visualizing Mathematical Relationships
Maxima isn't just about symbolic manipulation; it also excels at creating informative 2D plots. Here's how to explore some graphical examples:
1. Plotting a Basic Function:
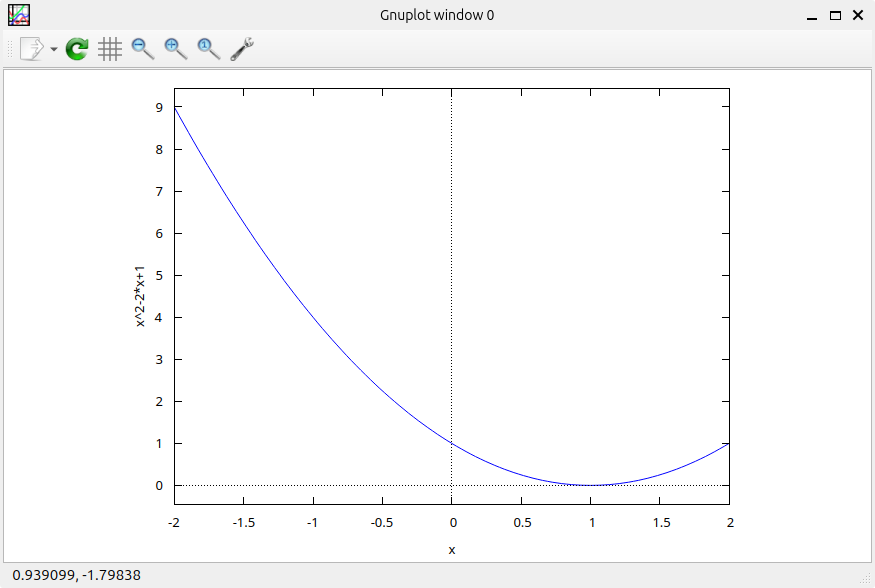
Let's visualize the function f(x) = x^2 - 2x + 1. Use the plot2d function with the expression, variable range, and desired plot window:
plot2d(x^2 - 2*x + 1, [x, -2, 2]);
This will generate a plot of the parabola defined by the function.
2. Parametric Plots:
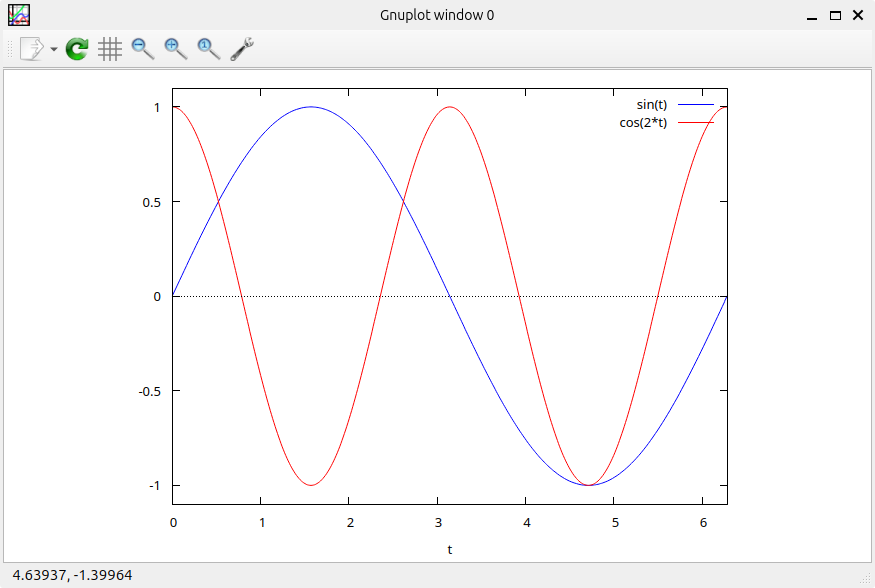
Maxima can plot functions defined parametrically. Let's create a Lissajous curve:
plot2d([sin(t), cos(2*t)], [t, 0, 2*%pi]);
Here, t varies from 0 to 2π, and the first expression defines the x-coordinate, while the second defines the y-coordinate, resulting in a beautiful looping curve.
3. Plotting Multiple Functions:
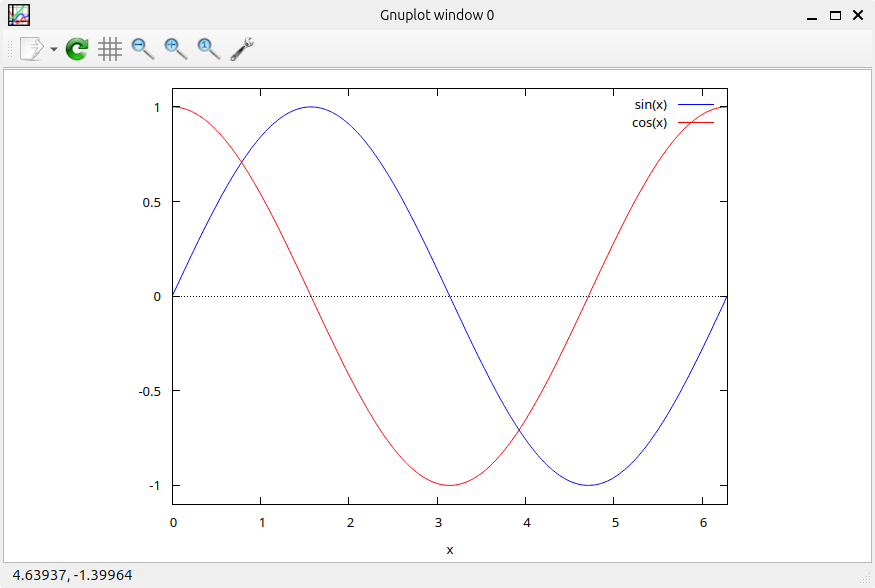
Compare two functions with a single plot:
plot2d([sin(x), cos(x)], [x, 0, 2*%pi]);
This will display the sine and cosine functions side-by-side within the specified x-axis range.
4. Customizing Plots:
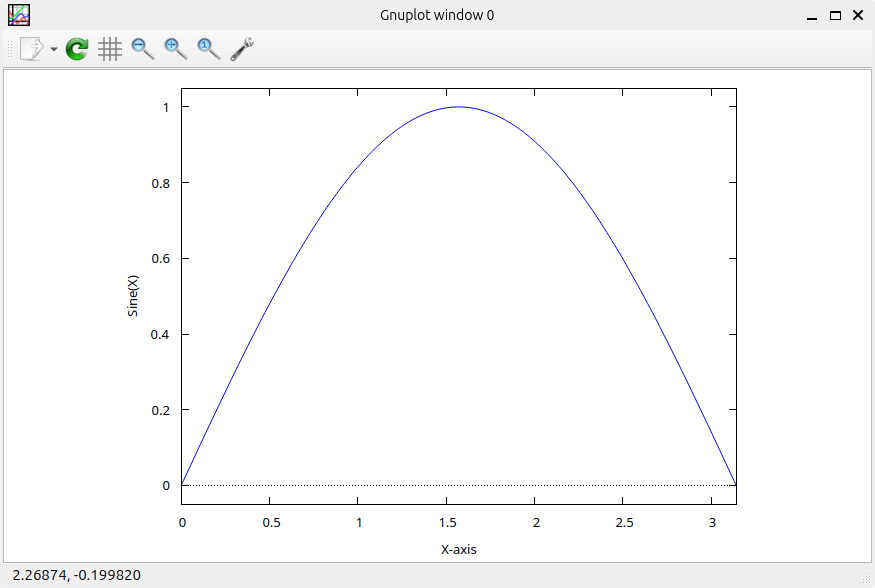
Maxima allows for plot customization. Let's add labels and adjust the plot range for the sine function:
plot2d(sin(x), [x, 0, %pi], [xlabel, "X-axis"], [ylabel, "Sine(X)"]);
This adds labels for the x and y-axes, making the plot more informative. You can further customize aspects like line colors, titles, and grid lines using additional options in the plot2d function.
These are just a starting point! Maxima offers a rich set of plotting features to explore and tailor your visualizations to your specific needs. So, fire up Maxima and start creating plots that bring your mathematical concepts to life!
3D Plots with gnuplot
While Maxima focuses on 2D plots, it can integrate with tools like gnuplot for 3D visualization. Explore the documentation for functions like gnuplot_plot3d to create more intricate plots.
Maxima itself primarily deals with 2D plotting, but it can leverage external tools like gnuplot to create 3D visualizations. Here's how to explore some 3D plot examples with Maxima and gnuplot:
1. Plotting a Surface:
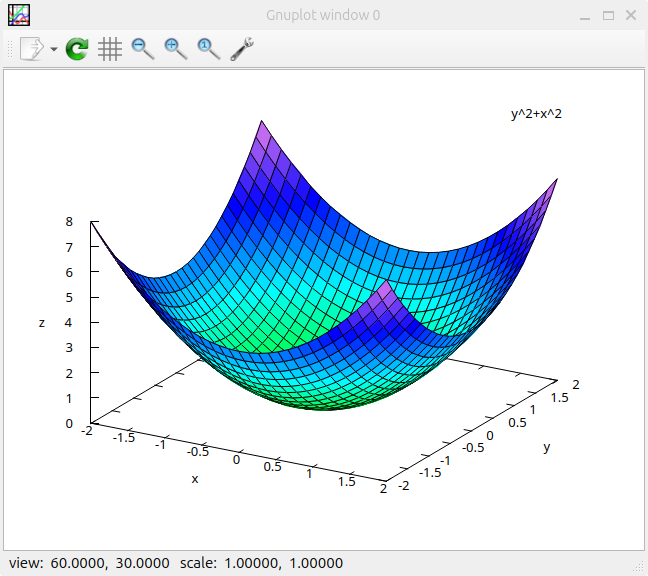
Let's visualize the function z = x^2 + y^2 as a 3D surface. You'll need gnuplot installed for this:
f(x, y) := x^2 + y^2;
plot3d(f(x, y), [x, -2, 2], [y, -2, 2]);
This code defines the function, plot range, constructs the gnuplot command using plot3d for formatting, and sends it to gnuplot with gnuplot. gnuplot will then generate the 3D surface plot.
2. Plotting Parametric Curves in 3D:
Let's plot a helix using parametric equations:
# Define parametric equations
x(t) := cos(t);
y(t) := sin(t);
z(t) := t;

# Define the parameter range (adjust as needed)
t_range := [0, 4*%pi];

# Prepare gnuplot command (using 'splot' for lines)
gnuplot_cmd := sprintf("splot for [t = %f:%f] (%s, %s, %s)",
                        t_range[1], t_range[2], x(t), y(t), z(t));

# Send the command and display the plot
gnuplot(gnuplot_cmd);
Here, we define parametric equations for x, y, and z coordinates of the helix and the parameter range for t. The gnuplot command is constructed with sprintf and uses splot for to define the parametric curve. Sending it to gnuplot will generate a 3D plot of the helix.
3. Visualizing Data Points:
Maxima can export data points to a file and use gnuplot for visualization. Imagine you have data for temperature variations at different locations. Export the data to a file and use gnuplot's plot command to visualize it as points in 3D space.
These are just a few examples, and gnuplot offers a vast array of options for customizing 3D visualizations. Remember to consult gnuplot's documentation for in-depth control over plot appearance.
While Maxima itself doesn't have a fully integrated 3D plotting engine, its ability to work with gnuplot expands its capabilities and allows you to explore the world of symbolic math in three dimensions.